Does Dynatrace Really Deliver?
A qualitative framework for thinking about Dynatrace, and tech companies in general

Dynatrace is an observability platform that helps companies see, understand, and solve problems in complex digital systems. At the most basic level, it helps them answer four questions: what is happening now, why it is happening, how big the impact is, and what should happen next. Then it uses data to show whether the problem was actually solved.
(If you want to read a full analysis of Dynatrace, here you are!)
The company takes scattered operational data and turns it into one chain of evidence, so engineers and business teams can make decisions faster and with more confidence. It maps system structure and dependencies, aligns different kinds of data on the same timeline, and reduces alert noise so teams can get closer to the root cause instead of wasting time going in circles. In that sense, what Dynatrace really does is make a complex system more explainable, more actionable, and more governable.
But the more important question is still this:
Does this story actually work in the real world?
Before going into abstract metrics, I think it helps to first look at one customer case. Otherwise, words like observability, workflow embedding, or platform value can sound too abstract. A real case makes the value easier to feel.
A Real Example: Next
Next is a retail and e-commerce company with 9.3 million online customers and operations across more than 70 countries. It also has a business called Total Platform, where third-party brands such as Victoria’s Secret, Gap, and Reiss run on Next’s infrastructure. That means it is not only responsible for its own digital experience, but also for the experience of its partners. If the online journey breaks, the impact can spread very widely.
Its pressure came from two places.
The first was growth. Online website and mobile sales were growing quickly and had already become more than half of the company’s revenue. So online experience was central to revenue.
The second was speed of change. Next had around 2,000 developers making up to 7,000 changes to digital services every week. The more changes a company makes, the more chances there are for something to break. During seasonal peaks, even a small drop in online experience can turn into a meaningful revenue risk.
In that context, what Next needed was better visibility into the customer journey. It needed to see what was actually happening in the system from the moment a customer opened a page to the moment they checked out.
After evaluating the market, the company chose Dynatrace. One key reason was its real user monitoring and session replay capabilities. Unlike some tools that rely on random sampling, Dynatrace can capture every user session. That matters because many customer issues are occasional. If you only sample, you may miss the one session that actually explains the problem. And if you cannot catch it, you cannot explain it. If you cannot explain it, you cannot solve it.
After adopting Dynatrace, Next used it in four main ways.
First, it reduced the risk that comes with rapid innovation. Because the company changed things so often, it needed to know quickly whether a release had made the experience worse or whether it had actually delivered the expected result. If a journey became slower or abnormal, teams could identify and adjust it faster. They could also use the data to show internal teams and third-party partners whether an update was actually good or bad.
Second, it helped solve customer issues faster. Session replay allowed service teams to see what users actually saw and what path they actually took. That meant teams did not need to guess, and customers did not need to repeat long explanations over and over again. Teams could identify the root cause faster and give customers a clearer explanation of what was going on.
Third, it made cross-team collaboration faster. The platform was not only used by technical teams, but also by customer service, marketing, finance, and even third-party partners. Everyone was looking at the same data and the same chain of evidence. So when something went wrong, different teams could align much faster on what happened, how large the impact was, who should own it, and what needed to happen next.
Fourth, it helped reduce fraud risk. Because a meaningful part of Next’s online business was tied to credit, the company used Dynatrace to monitor customer journeys in real time and flag suspicious behavior. One example in the case was that if the same user tried to log into multiple accounts in the same session, the system could flag it so the fraud team could step in quickly.
I think this case makes Dynatrace’s value much more concrete.
The value is that it helps a company see where revenue risk, customer friction, organizational confusion, and even fraud risk are actually happening in real time. It turns technical complexity into something people across the company can understand and act on.
Once that becomes clear, the more abstract numbers become easier to understand.
How That Value Shows Up in a More Quantifiable Way
What I think Dynatrace did smartly is that the thing it sells can look optional at first glance. Because of that, it spent time and money quantifying the result, so customers could more clearly see the business value it created. It worked with IDC on business value white papers, which try to make this value visible in a more measurable way.
The clearest value can first be understood through two categories:
First, less downtime and less loss.
Second, less human time wasted.
According to the study, the number of severe incidents, meaning major system failures and serious service disruptions, fell from 52.4 per year to 33 per year, a 37% decline. At the same time, the average repair time dropped from 2.9 hours to 1.3 hours, a 56% decline. As a result, annual revenue loss linked to these incidents fell from 4 million dollars to 1.1 million dollars, implying about 2.9 million dollars in annual loss avoidance.
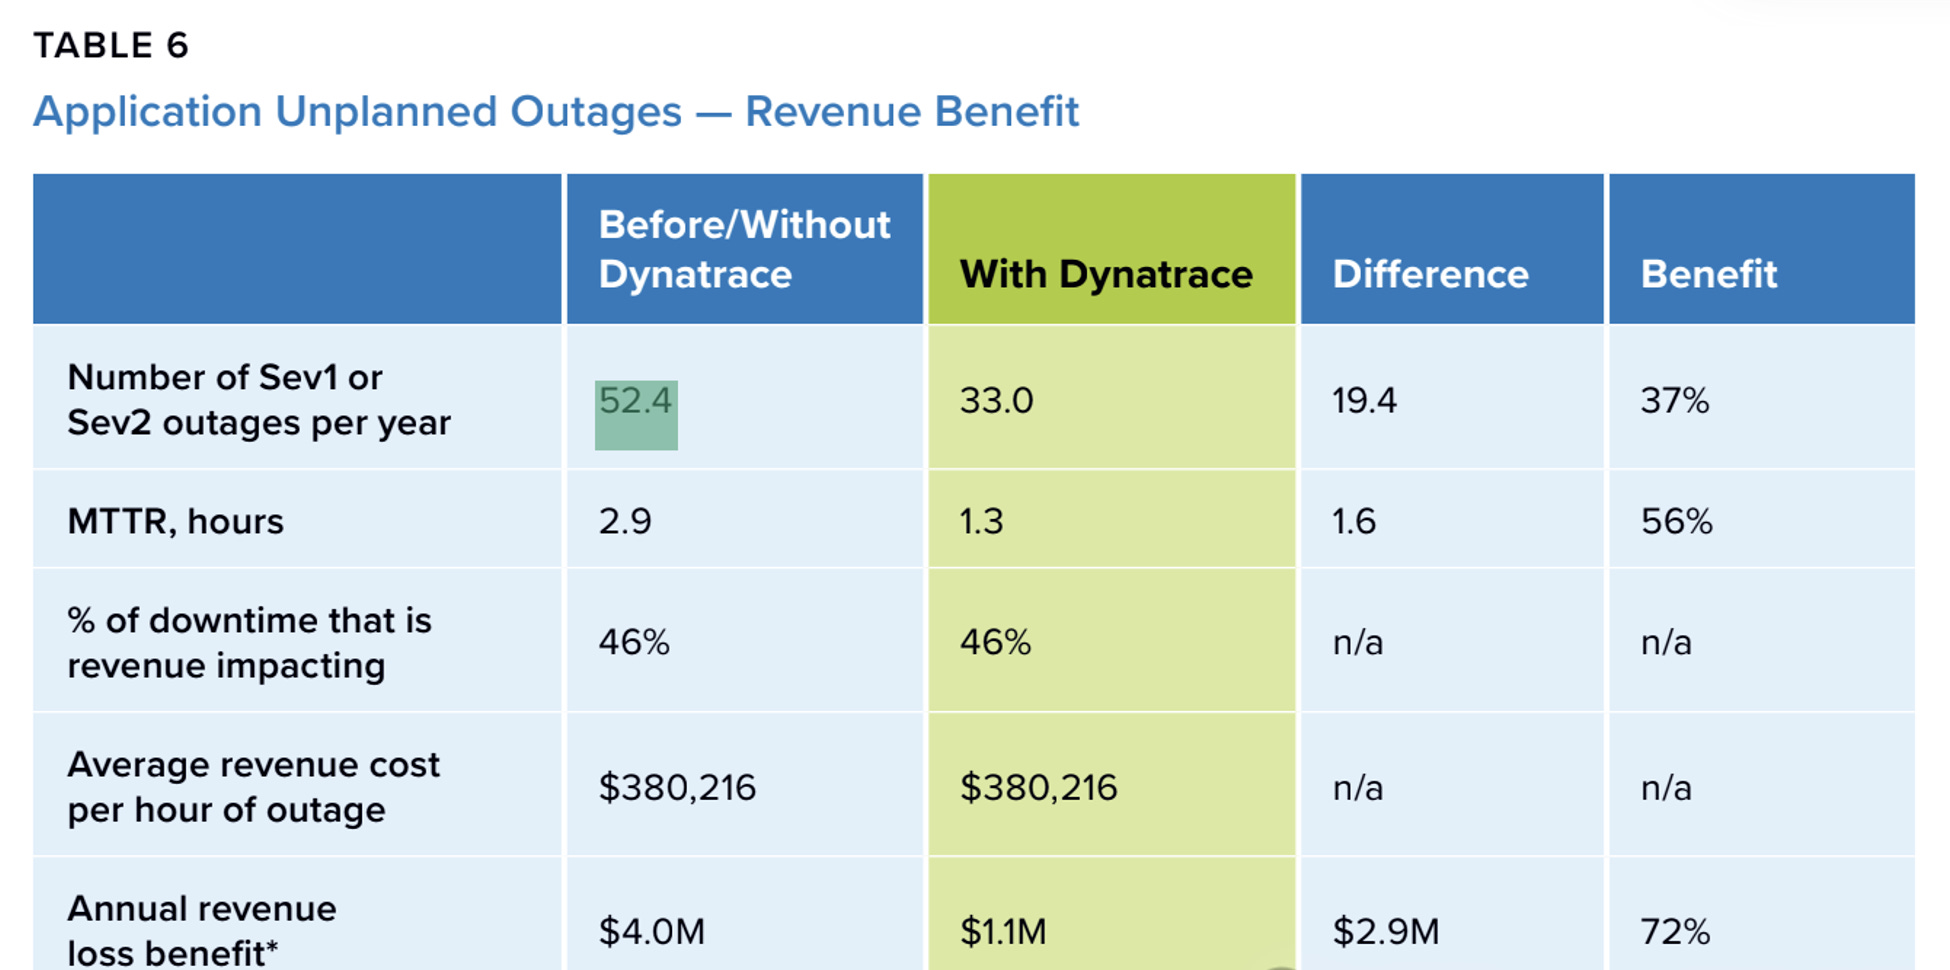
Source: lDC Business Value In-Depth Interviews, March 2024
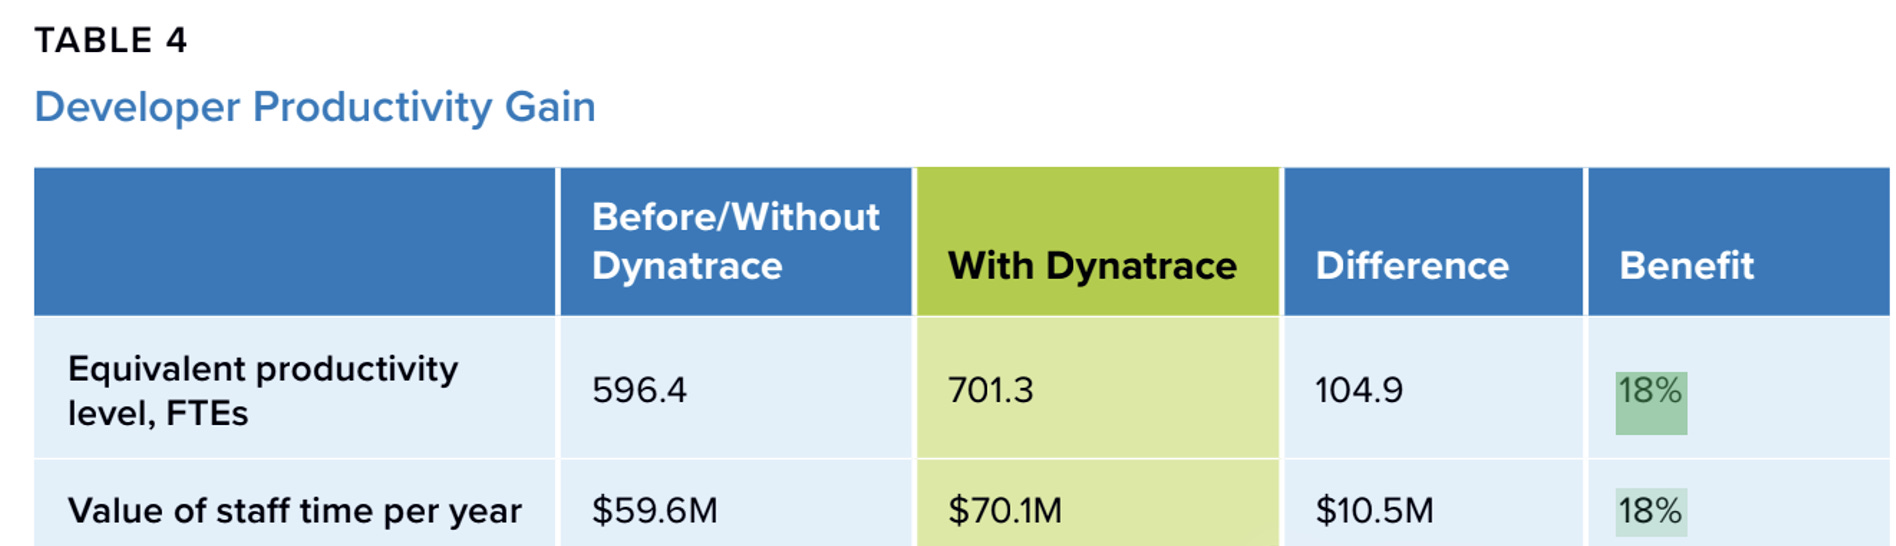
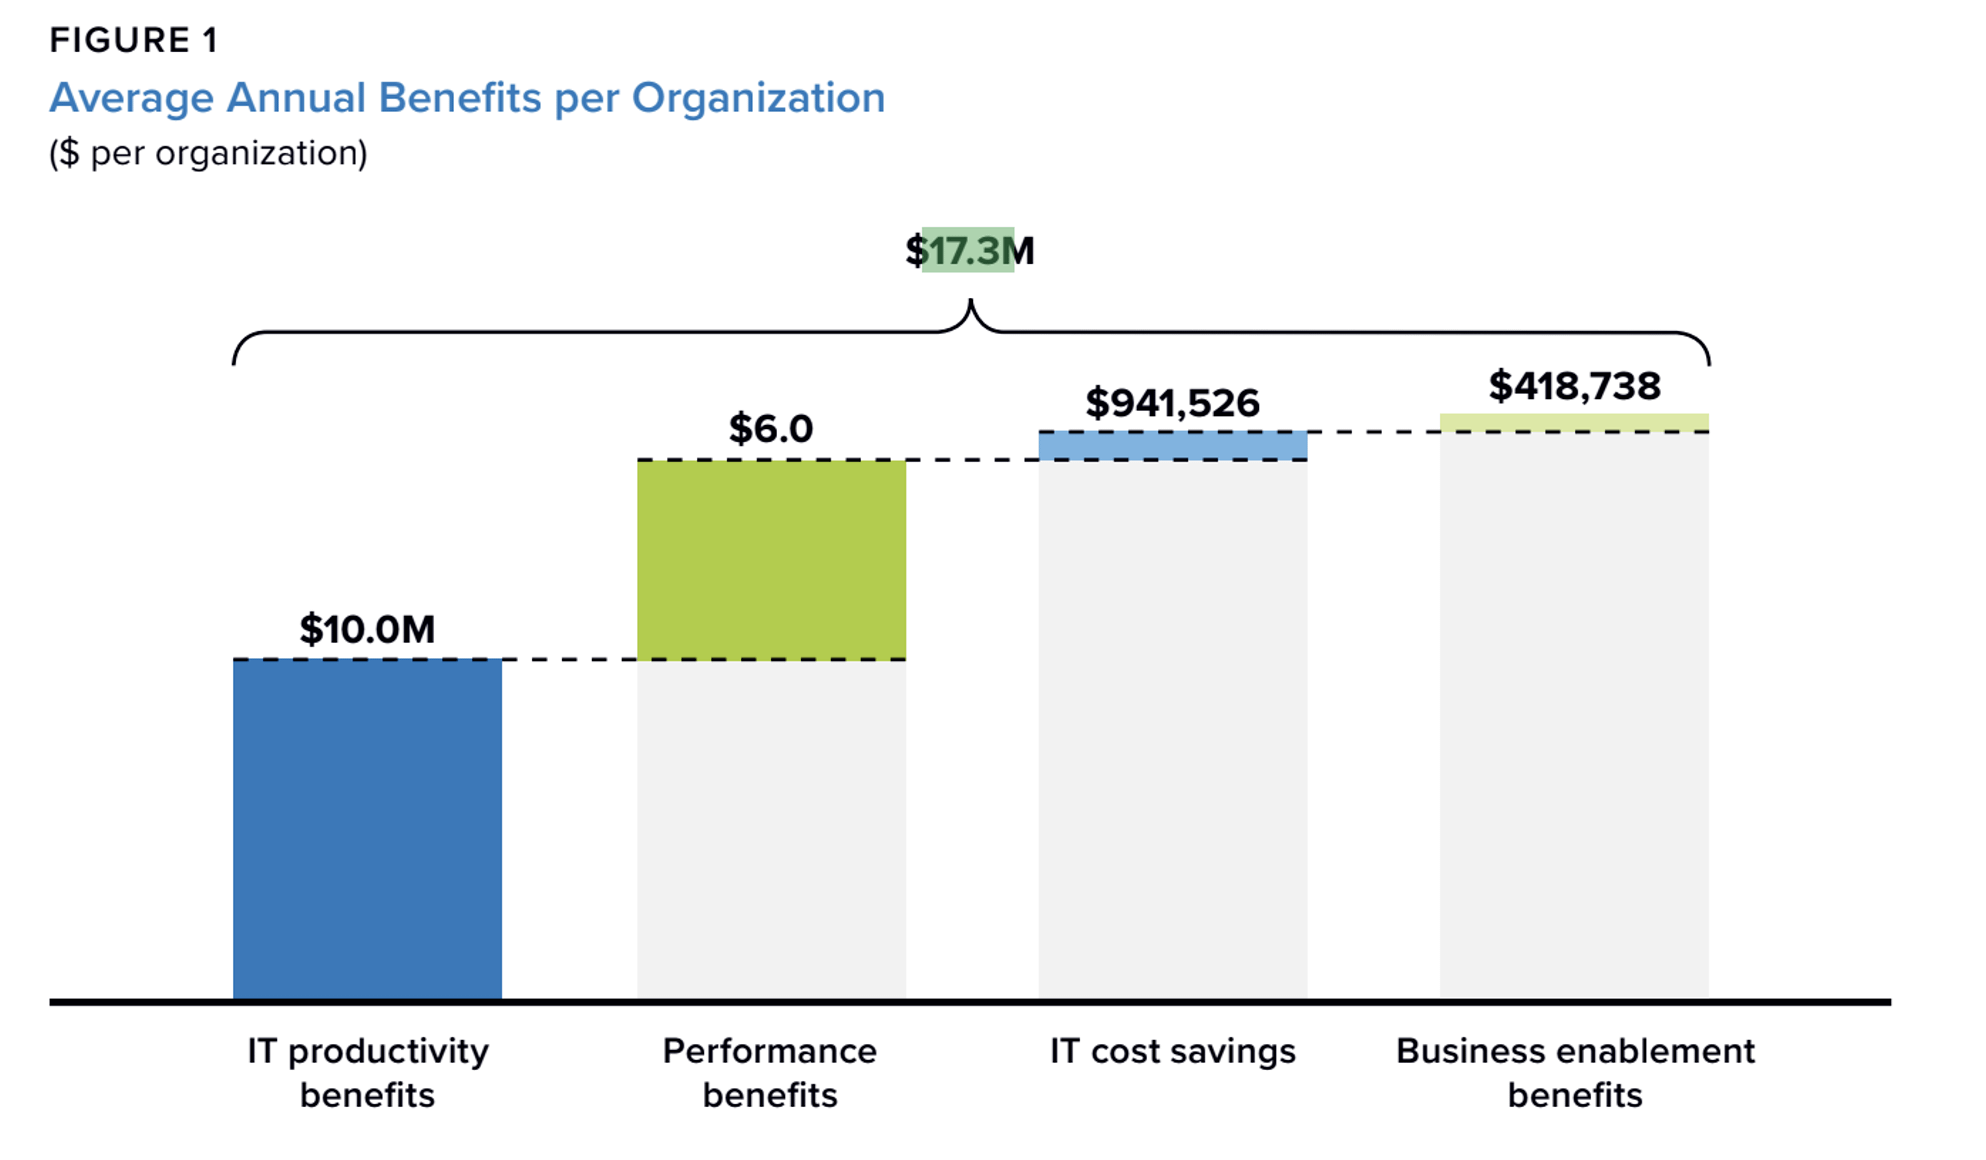
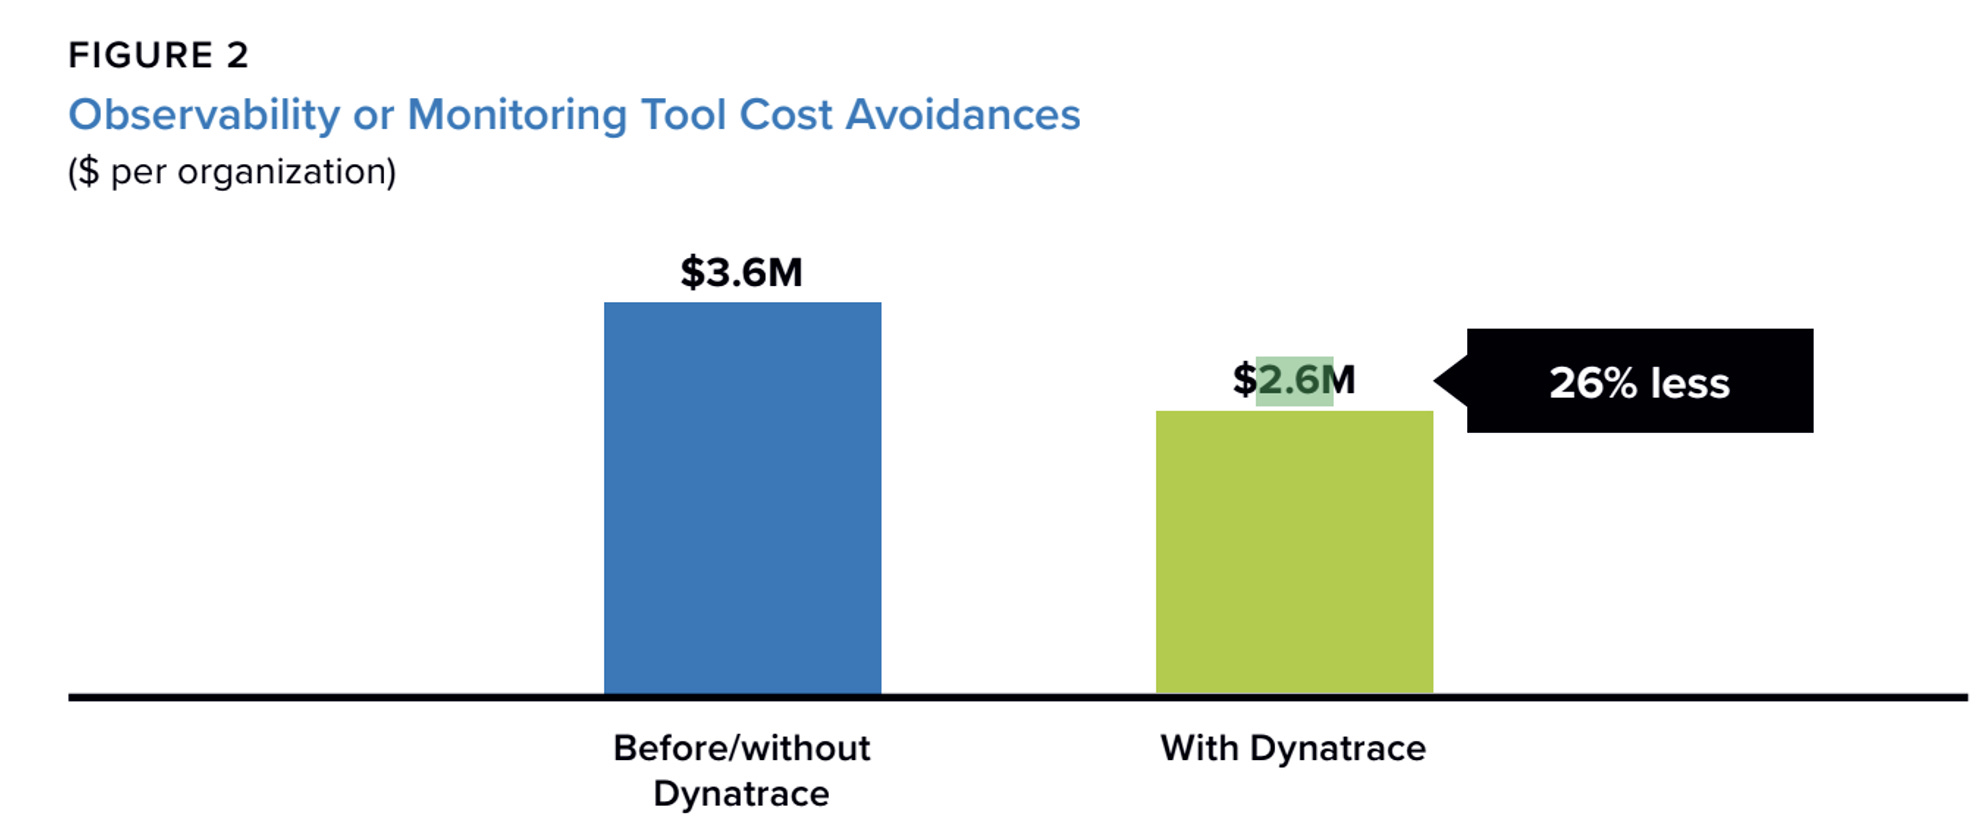
The second category is efficiency. The study says platform administrators improved efficiency by 53%. IT, DevOps, and application performance teams improved by 28%. Developer productivity rose by 18%. At the company level, the combined value of saved money and avoided losses averaged about 17.3 million dollars per year, and the annualized benefit per 100 supported applications was around 2.6 million dollars.
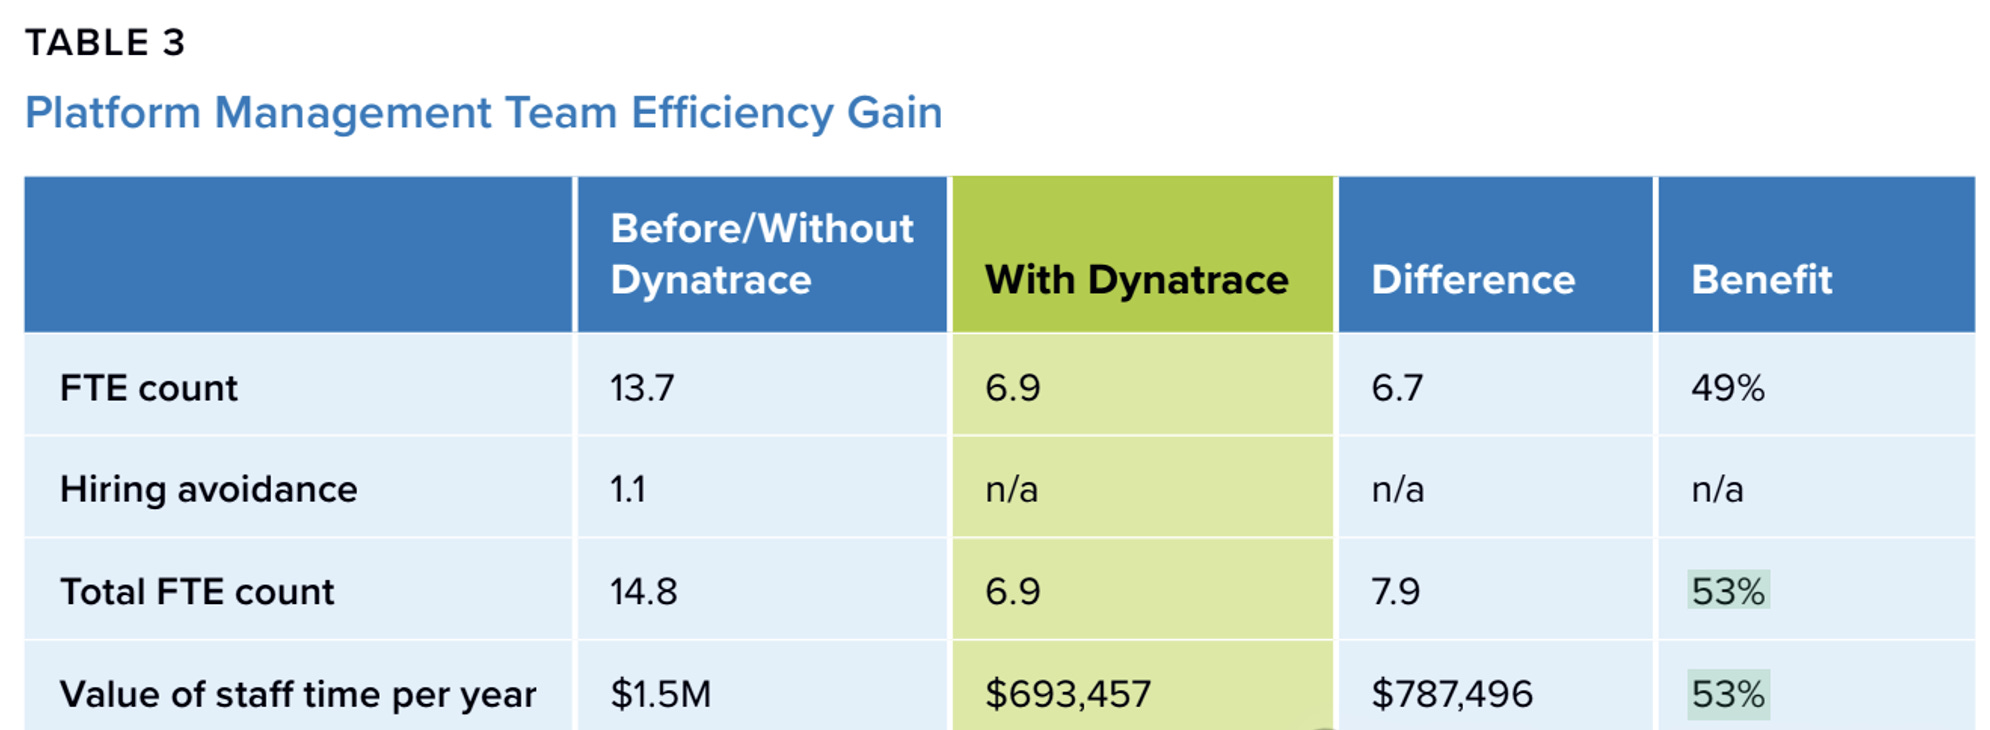
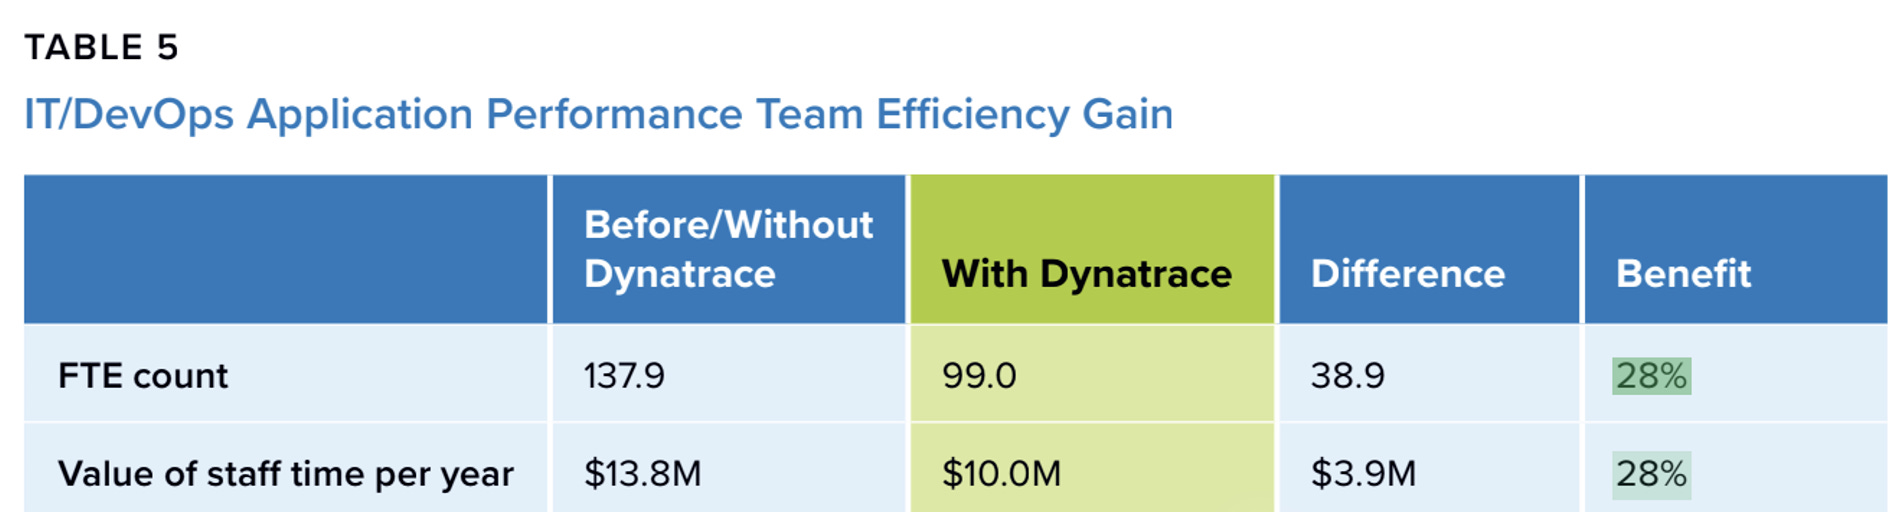
Source: lDC Business Value In-Depth Interviews, March 2024
From here, Dynatrace’s business value can be summarized in three lines.
First, fewer major incidents and shorter incident duration, so direct losses go down.
Second, less human time is wasted on finding causes and aligning information, so team efficiency goes up.
Third, when it becomes a shared language across teams, management can connect technical issues to business outcomes faster, and make trade-offs faster.
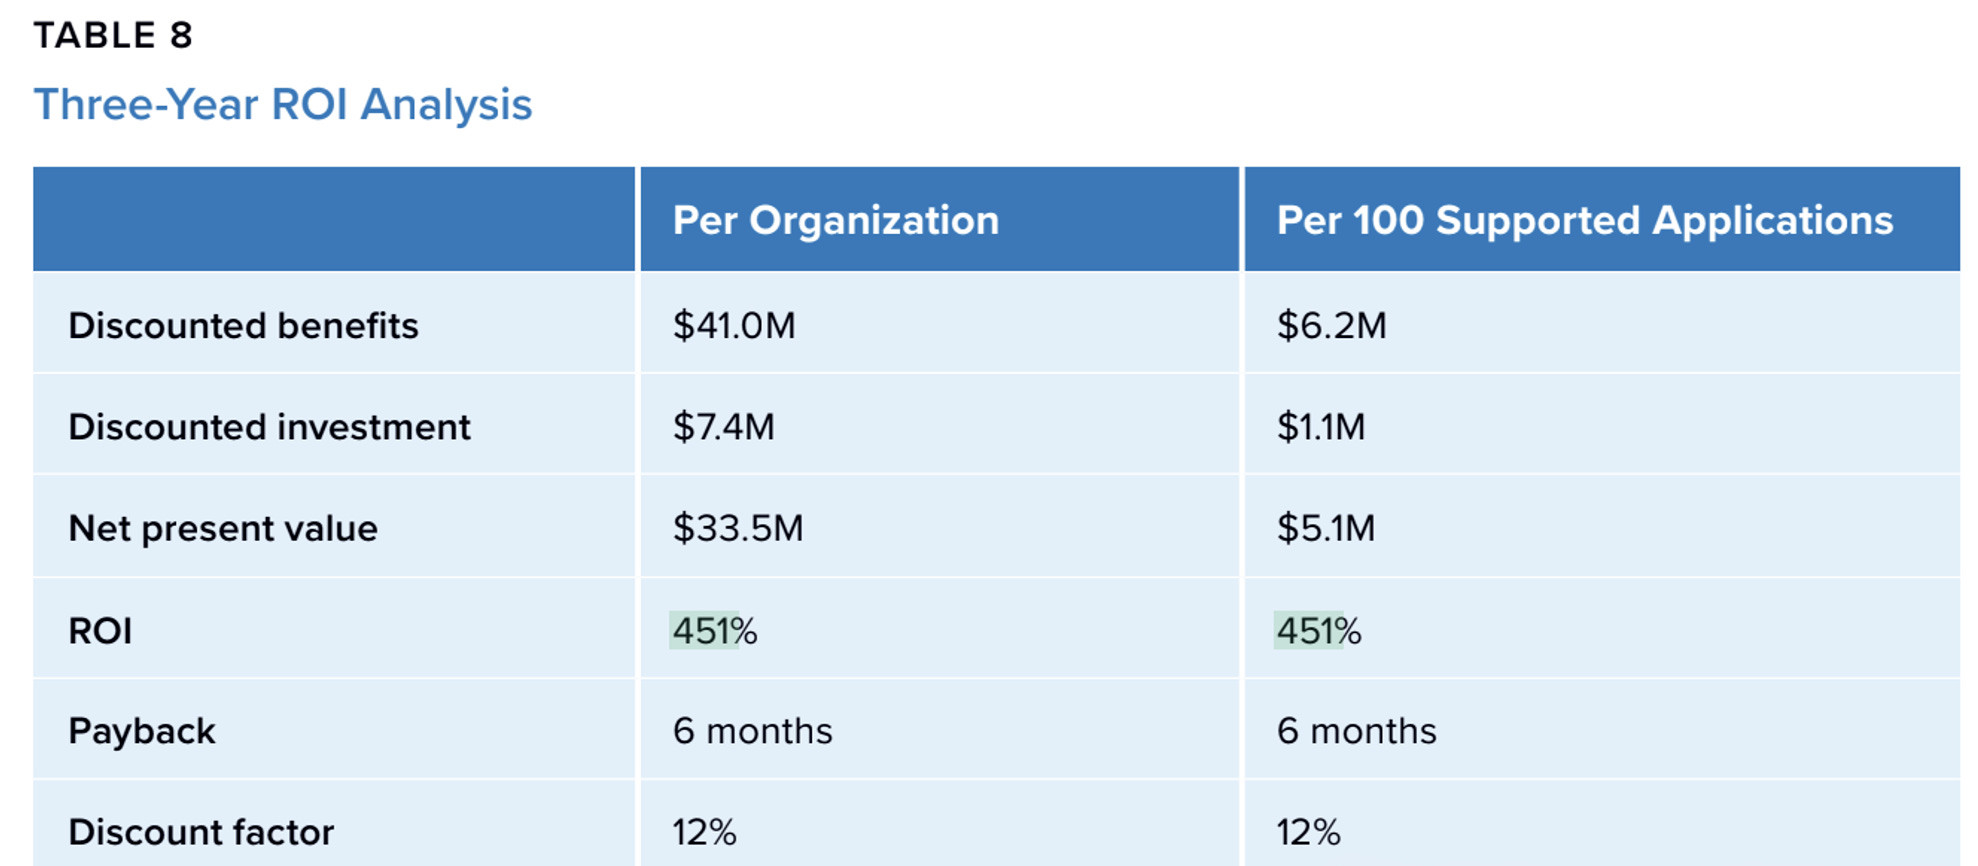
A more summarized way to see this is ROI. In the white paper, the reported ROI is 451%, with a payback period of about six months.
Source: lDC Business Value In-Depth Interviews, March 2024
A very simple way to feel that number is this: If a company spent 1 million dollars on the platform over three years, including subscription and implementation costs, then a 451% ROI would imply total benefits of around 5.5 million dollars. Roughly 1 million dollars would cover the cost, and around 4.5 million dollars would be net benefit.
*By the way, this is only a simplified example to make the ratio more intuitive. It is not real company data.
Then We Come Back to the Business Itself
If we want to understand Dynatrace as a company, then we have to go back to operating metrics.
For this kind of observability platform, growth does not come from selling a product once and being done. Usually, a customer starts small, then expands inside the same company, then adds more modules, and eventually turns the product into a shared platform used across many teams. If that is the path, then the company’s most important questions also appear in sequence. And the metrics we watch should follow that same sequence.
I think the framework can be understood in three steps:
Step one, land.
Can the product actually get adopted in a real environment and solve an immediate problem.Step two, expand.
Can the company deepen usage inside existing customers in a way that is economically attractive.Step three, become a platform.
Can the product move from being a tool to becoming shared infrastructure inside the organization.
Step One: Land
At this stage, the main risk is whether it can sell it and get the customer to actually use it.
Customers usually begin with one system, one team, or one business line. So the key question is whether the product can solve a real problem quickly enough that the customer wants to renew and expand spending.
That is why the first thing to watch is growth and retention, especially Annual Recurring Revenue (ARR) and Dollar-Based Net Retention Rate (DBNRR). These tell us whether customers are moving from pilot use into continued expansion.
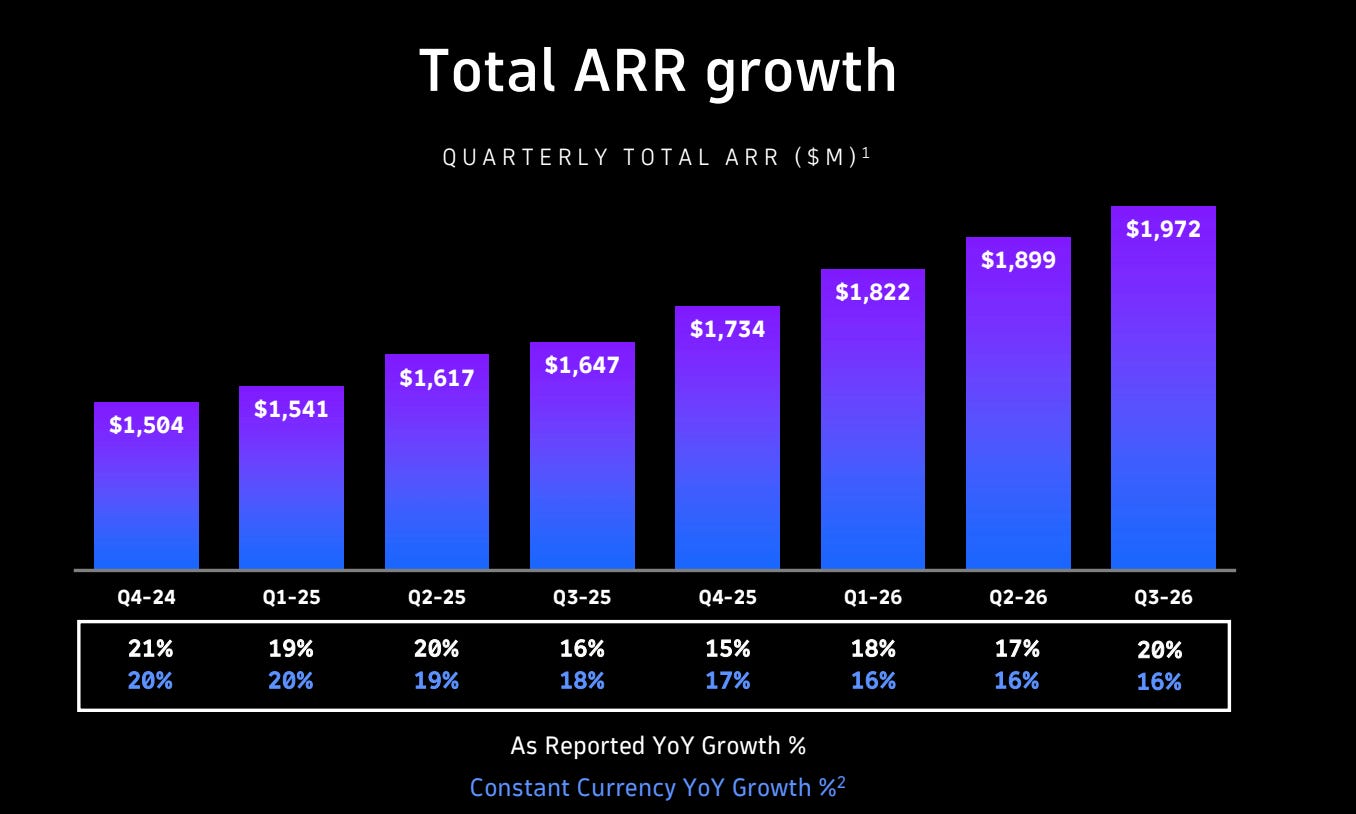
Source: Dynatrace Q3 26’ Investor Presentation
Dynatrace disclosed about 1.97 billion dollars of ARR in fiscal 2026 Q3. That matters for two reasons. First, it shows the company is already operating at meaningful enterprise scale. Second, the fact that ARR is still growing suggests it is not only defending its installed base, but also still adding new business and expansion.
Its NRR was 111%. That suggests existing customers are still deepening usage and paying more overall, so expansion is still covering contraction and churn. At the same time, 111% does not look extreme. It looks more like a healthy number for a mature enterprise software business, showing that the expansion engine is still working, but it is not running at an unusually aggressive speed.
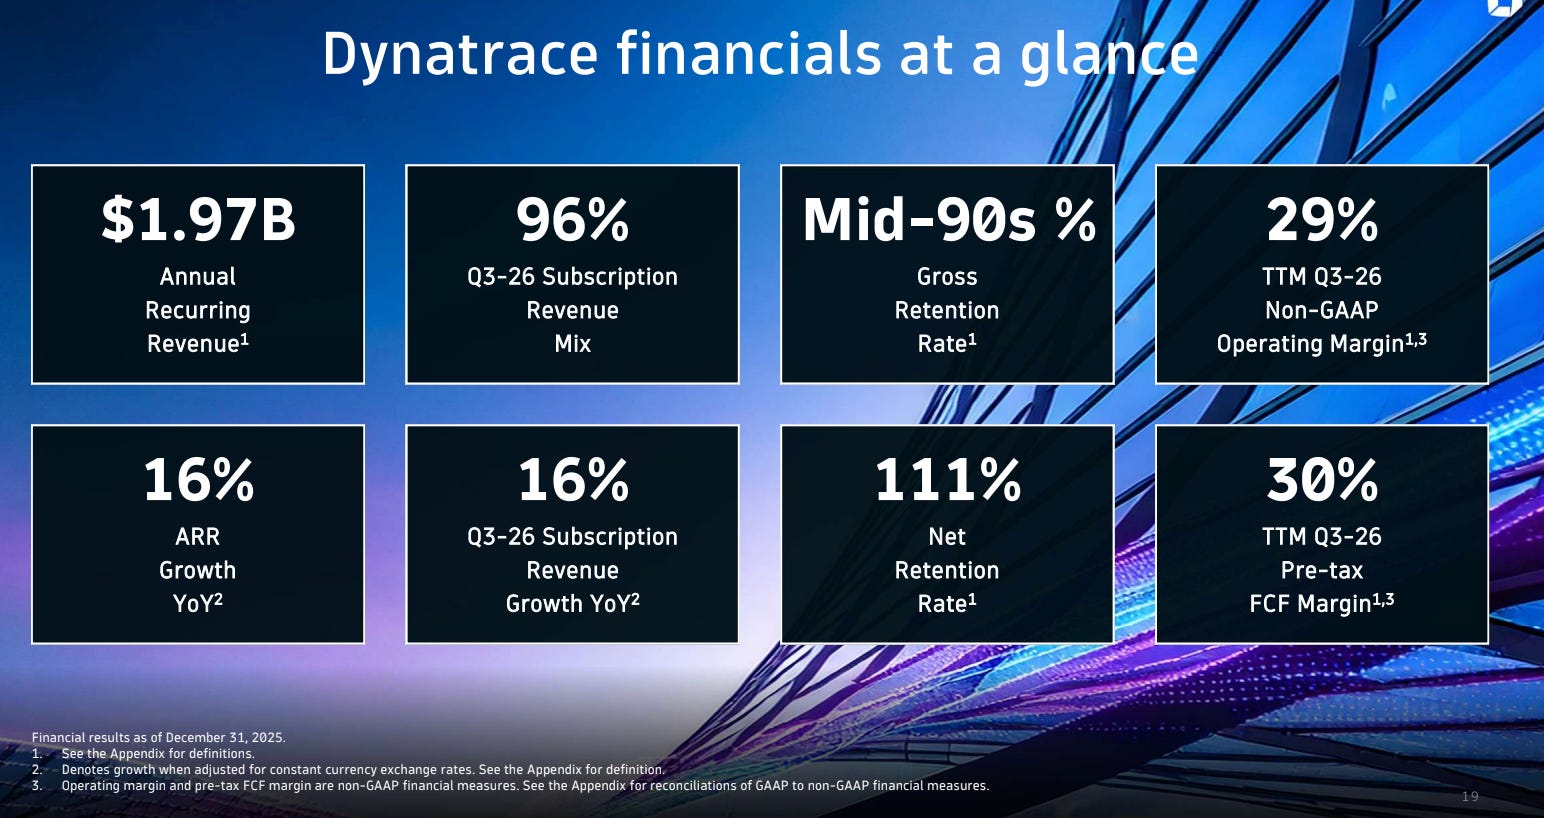
Source: Dynatrace Q3 26’ Investor Presentation
This number only becomes meaningful through comparison. Compared with its own history, the broader trend has been downward, which suggests Dynatrace has already moved past its highest-growth phase and is now in a more stable stage. Compared with peers, 111% looks healthy, but not exceptional. So the number is good, but the trend still matters.
Step Two: Expand
At this stage, the main question is how deeply it can expand within existing ones.
Once enterprise customers believe in the value, expansion is often cheaper and more stable than acquiring new customers. But this stage also exposes whether scale is really improving the business or whether cost is starting to rise with usage. Observability goes deeper as customers generate more data, and that can create structural pressure on storage and processing costs.
So here, the main things to watch are unit economics and cost structure. Is subscription gross margin stable? Is free cash flow improving? Is the company having to spend more and more on sales just to get the same kind of growth? If those metrics weaken, expansion may be happening through discounting, more people, or higher delivery costs, which would be harder to sustain.
Dynatrace reported subscription gross margin of 85% and services gross margin of 3% in fiscal 2026 Q3. An 85% subscription gross margin is strong. It suggests that customers are willing to pay, and that Dynatrace is not being dragged down too heavily by cloud or data processing costs. The 3% services gross margin looks low, but in enterprise software that is not necessarily a bad sign, because services are often used to help customers adopt the product rather than to generate profit themselves. The real concern would be if services became a larger share of revenue while still remaining low-margin, because that could suggest the business depends too much on human delivery.
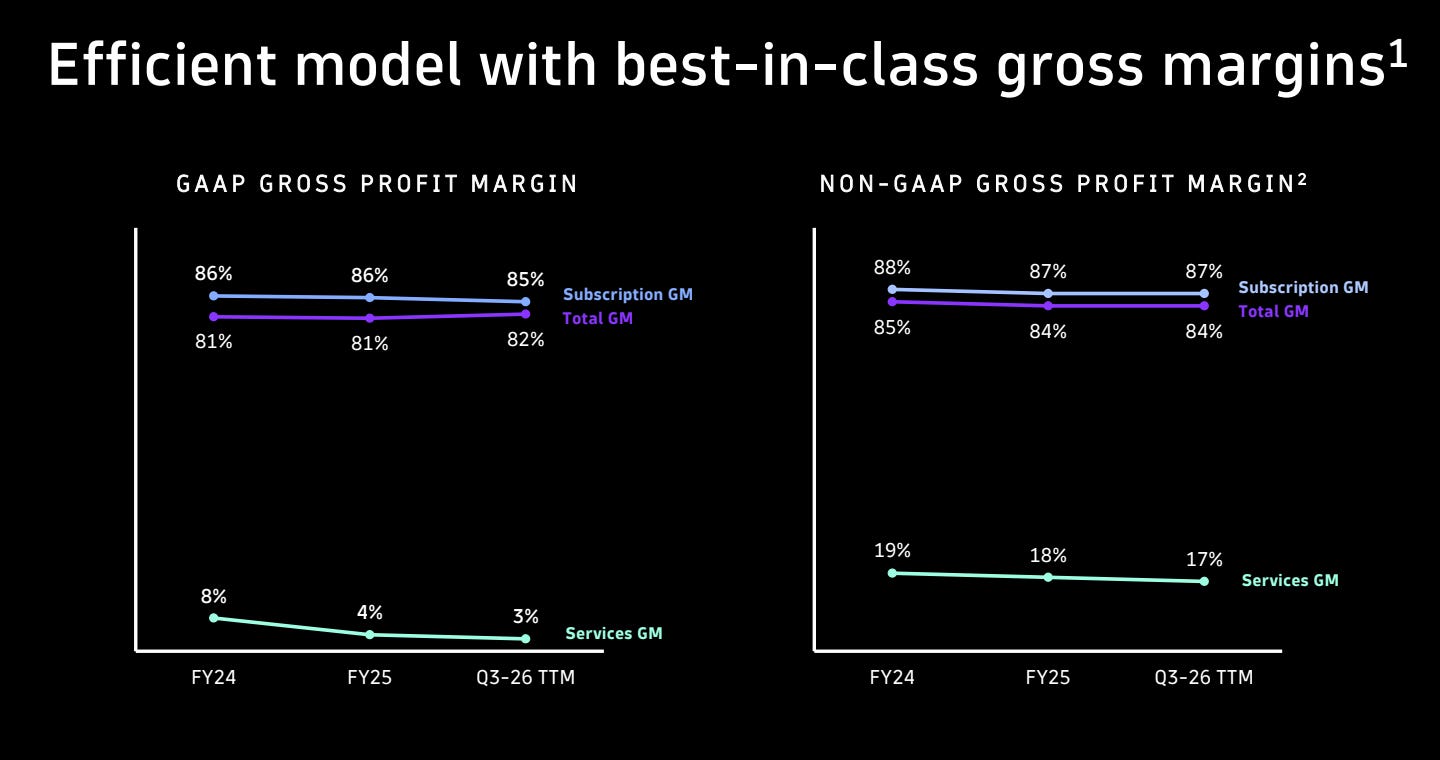
Source: Dynatrace Q3 26’ Investor Presentation
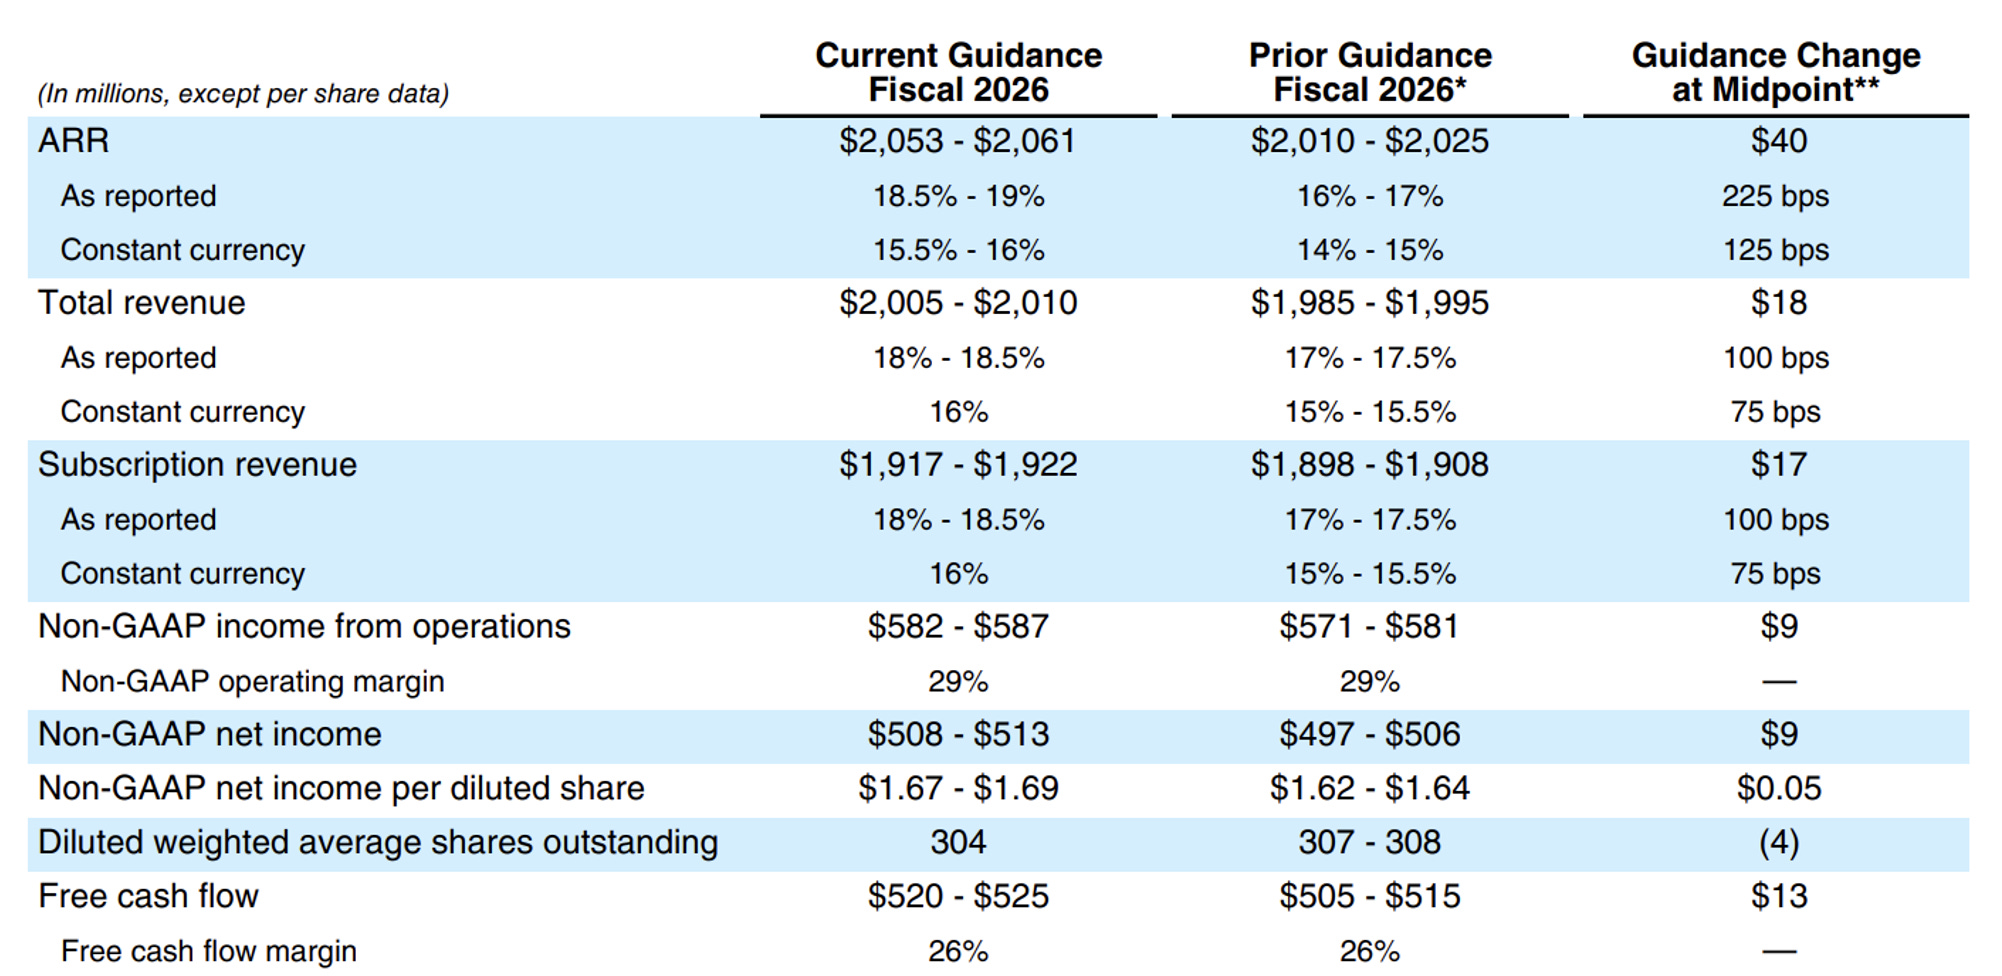
The company also reported quarterly free cash flow of 27.234 million dollars and free cash flow margin of 5%, while guiding to a full-year free cash flow margin of 26%. A single quarter can move around, so I would not read too much into that one number alone. But if full-year free cash flow margin can really stay around 26%, that suggests the company is still able to turn revenue into meaningful cash generation.
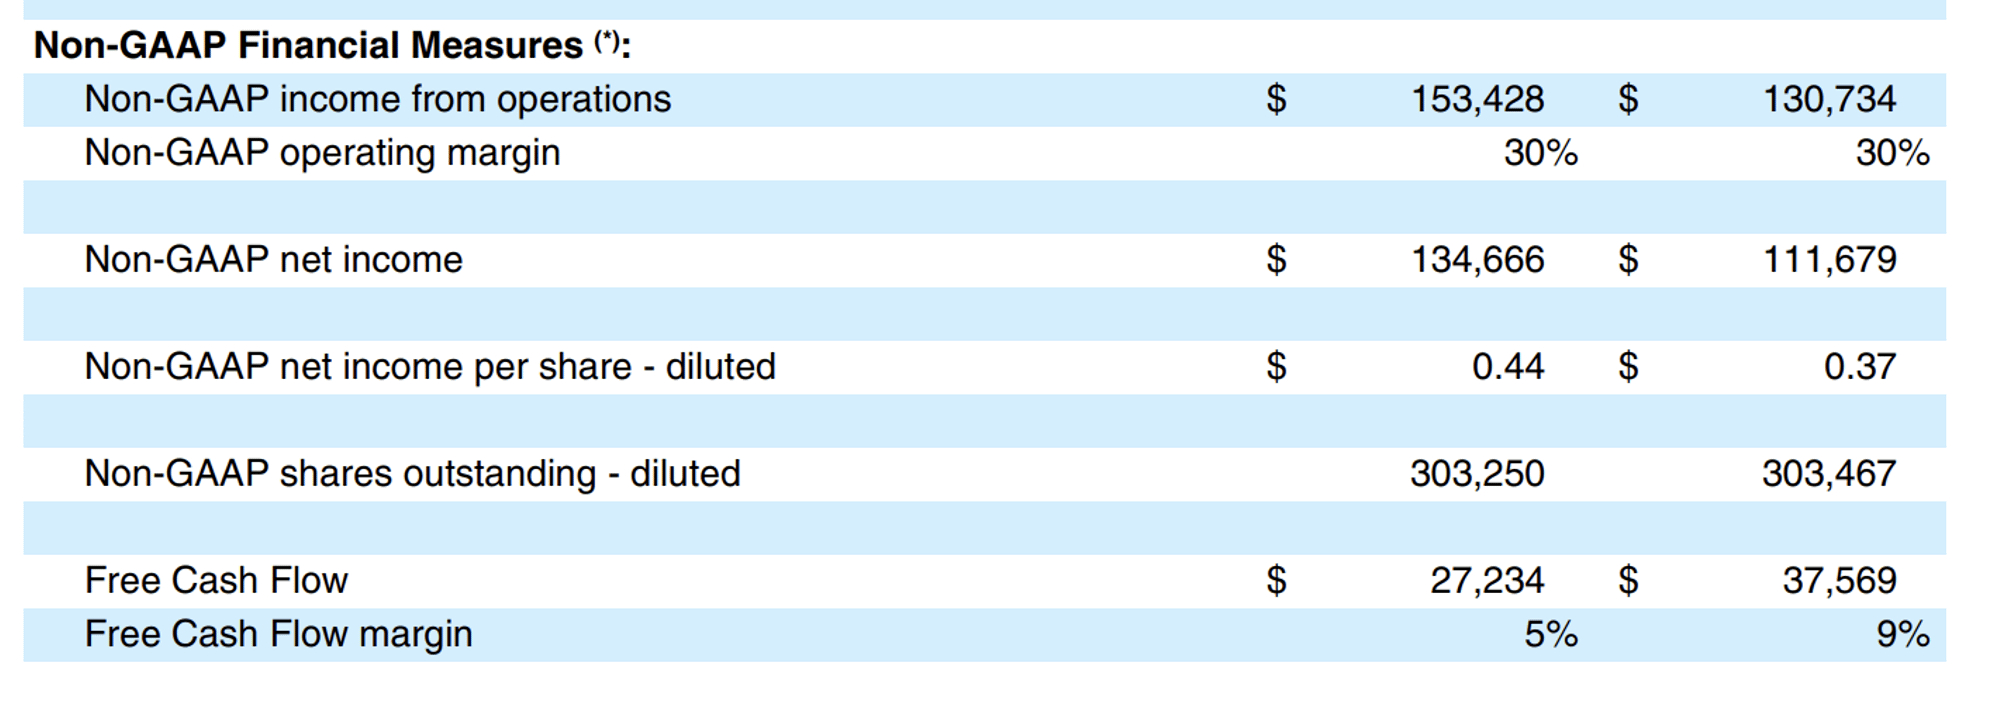
Source: Dynatrace Q3 26’ News Release
More broadly, the business still looks like a subscription-led enterprise software model. Subscription revenue remains the main revenue source, while services are a relatively small piece. That matters because it means the company still looks like a software business with scale benefits, not a services-heavy business where growth is tied too closely to labor.
Step Three: Become a Platform
This is the stage where the real question becomes whether Dynatrace is becoming shared infrastructure.
At this point, the most important thing is not customer count by itself, but how deeply and broadly the product is used inside each customer. Is it spreading across teams. Is it spreading across modules. Is it becoming part of real daily workflows.
I think there are four signals to watch.
1. Multi-module penetration
Are customers buying more than one product? Is management increasingly talking about broader platform adoption rather than single-product adoption? Dynatrace’s own filings emphasize expanding relationships inside existing customers, broadening platform capabilities, and using its DPS licensing model to drive wider platform consumption?
2. Large customers going deeper
Platformization often shows up first in large enterprises, because they have more complexity, more teams, and more to gain from using one shared system. So what matters is whether more of them are expanding from narrow use into broader organizational adoption.
3. Usage depth
Ideally, we would have direct numbers like monitored services, containers, active users, queries, or automation actions. If the company does not disclose those, then NRR and large-customer expansion stories can work as rough substitutes, because deeper usage usually shows up through existing customers spending more.
4. Workflow embedding
This is where a product starts feeling like infrastructure. Does it sit inside ticketing systems? Does it connect to on-call systems? Are customers using it to guide service-level management, alert reduction, and automatic root cause analysis? Companies do not always disclose one clean number here, so often this has to be judged through recurring patterns in customer stories and management language.
What Would Real Competitive Pressure Look Like
At the platform stage, competition does not always show up first as obvious churn. More often, it shows up as slower decisions, larger discounts, shorter contracts, and weaker visibility.
So I think there are four practical things to watch.
1. Pricing and discount pressure
If the company has to cut price or promise more costly delivery in order to win deals, subscription gross margin should start to weaken. So far, Dynatrace’s margin still looks relatively stable. That suggests it is not being badly squeezed yet, even if it is clearly no longer in a high-growth phase.
2. Contract structure
Dynatrace disclosed 3.2032 billion dollars of RPO as of December 31, 2025, and said 53% of that would be recognized over the next twelve months. That gives a rough near-term revenue visibility figure of about 1.6977 billion dollars. On its own, that does not tell us whether the trend is improving or weakening. But it does give a clearer framework for thinking about short-term visibility and contract depth.
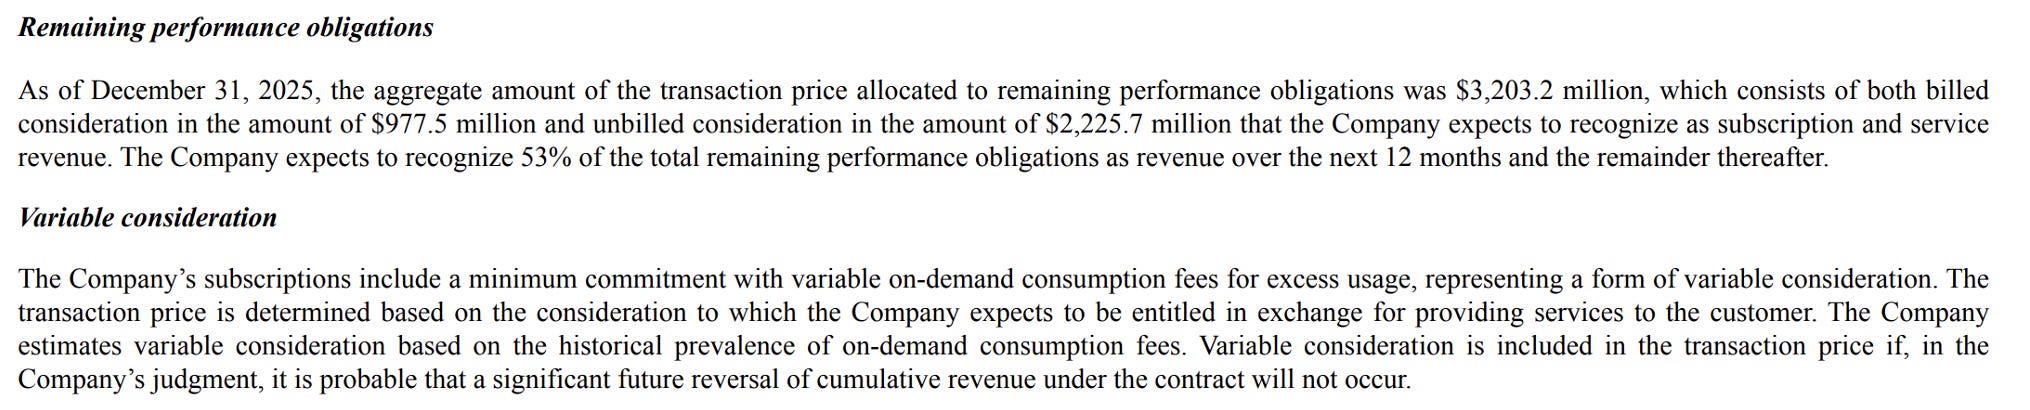
Source: Dynatrace Q3 26’ 10Q
3. Sales cycle length
If enterprise decision-making gets slower, approvals become stricter, and customers become more cautious, that usually shows up first in weaker order visibility and slower new ARR formation.
4. Replacement and bundling pressure
At this stage, Dynatrace is not only competing with other observability vendors. It is also competing with cloud-native tools and larger vendors that may bundle logging, security, and cost management together. So one of the most important things to watch is whether Dynatrace can keep convincing customers that a unified data model, unified governance, and unified workflow really matter enough to justify a standalone platform.
Final Thought
At this point, I think the more useful takeaway is not just how to understand Dynatrace, but how to analyze tech companies more generally. The key is to start with how a company actually creates value for its customers in the real world, then ask what metrics can help quantify that value. From there, you can test the business both horizontally, by comparing it with peers, and vertically, by looking at whether that value creation holds up over time.
That is the framework I am trying to build for myself when I study companies. First identify the real source of customer value. Then connect that value to the operating and financial data that can support it. Only after that does the model start to feel meaningful, because the numbers are no longer floating on their own. They are tied back to the actual business reality.